AWH Announces Fourth Quarter and Full Year 2025 Results
Delivered Q4 2025 and FY 2025 revenue of $120.5 million and $500.6 million
Expanded Adjusted EBITDA Margin1 to 25.1% in Q4 2025 and 23.4% for FY 2025
Maintained strong liquidity with $85.7 million in cash and no significant near-term debt
Retail footprint reaches 48 locations as densification continues
NEW YORK, March 12, 2026 – Ascend Wellness Holdings, Inc. (“AWH,” “Ascend,” or the “Company”) (CSE: AAWH-U.CN) (OTCQX: AAWH), a multi-state, vertically integrated cannabis operator, today reported its financial results for the quarter and year ended December 31, 2025. Financial results are reported in accordance with U.S. generally accepted accounting principles (“GAAP”), and all currency is in U.S. dollars.
Q4 & FY 2025 Business Highlights
- Executed densification strategy throughout 2025 with eight new dispensary openings, broadening market presence and expanding retail footprint to 48 locations to date, including partner owned and operated locations.
- Ascend opened its first social equity partner store in Little Falls, New Jersey, with Mister Jones, LLC in Q4 2025. The Company has also secured approval from the New Jersey Cannabis Regulatory Commission for a second social equity partner store, which will be located in Eatontown, New Jersey and is expected to begin operations in April 2026.
- In the first quarter of 2026 (“Q1 2026”), AWH opened its sixth Ohio store and an additional partner owned and operated location in Illinois. Additionally, the Company closed an underperforming store in Ann Arbor, Michigan.
- The retail development pipeline includes 12 new locations, which would bring the Company’s total owned and partner owned and operated dispensaries to 60, pending regulatory approvals.
- Developed and launched a record 566 SKUs in FY 2025, including 146 in Q4 2025, surpassing an initial goal of 550 SKUs for the year, including:
- Debut of two new brands: High Wired infused flower and Honor Roll top quality pre-rolls made with 100% flower.
- Expansion of formats, flavors, and formulations across nearly all product lines, including Effin’ effects-based gummies and vapes, High Wired sugar caps, and Simply Herb disposable vapes, with many newly launched products ranking among AWH’s top-selling SKUs for Q4 2025.
- Launch of Ozone Liquid Diamonds vape and the ultra-limited Ozone King of Queen Cola.
- Following the quarter, in Q1 2026, AWH unveiled a full-scale brand and quality transformation of its flagship lifestyle brand Ozone, featuring a refreshed visual identity, elevated product standards, innovative packaging, and enhanced consumer engagement. The relaunch has begun in Illinois, Massachusetts, and New Jersey, with other key markets to follow in the coming quarters. A variety of new products will launch in tandem with Ozone’s evolution, including the brand’s first full-spectrum gummies, as well as new macro-dose gummies and additional flower and vape offerings.
- Maintained position among the top three brand houses by both sales and units across Illinois, Massachusetts, and New Jersey3 combined throughout FY 2025, reinforcing market leadership with an expanded suite of products and brands.
- Delivered a fully integrated e-commerce ecosystem, combining a redesigned shopping platform and app with AI-driven personalization, Ascend Pay pay-by-bank functionality, and an enhanced loyalty program, marking a key milestone in AWH’s customer-first strategy.
- Sales through Ascend Pay increased by 49.4% from the third quarter of 2025 (“Q3 2025”) to Q4 2025, driven by a 51.5% increase in transactions and a 57.8% rise in units sold through the pay-by-bank functionality across Ascend and partner owned and operated retail locations.
- In Q4 2025, Ascenders Club loyalty program total membership grew by 56% with active members increasing by 23.7% sequentially. Loyalty members accounted for 88% of retail transactions, which were up 16% for Ascend retail locations.
- Strengthened capital structure by fully repaying the Company’s $60.0 million term loan through a $50.0 million private placement of 12.75% Senior Secured Notes4 due 2029 and $10.0 million of cash on hand, completing its broader refinancing initiative in Q2 2025. AWH also secured $9.3 million in financing on three Ohio properties at a competitive 8.5% interest rate maturing in September 2030, to support disciplined growth and retail expansion.
- Successfully completed the normal course issuer bid (“NCIB”) share buyback program (the “Buyback Program”).
- The Company repurchased and retired approximately 15.8 million shares at an average price of $0.32 per share5 since the fourth quarter of 2024, when the Buyback Program was initiated.
Financial Highlights
Q4 2025
- Total net revenue was $120.5 million compared to $124.7 million in the third quarter of 2025 (“Q3 2025”).
- Retail revenue was $85.0 million compared to $83.8 million in Q3 2025.
- Wholesale revenue was $35.5 million compared to $41.0 million in Q3 2025.
- Net loss of $48.7 million, which includes a $17.0 million arbitration settlement expense (as detailed below), compared to $25.8 million in Q3 2025.
- Adjusted EBITDA1 was $30.2 million compared to $31.1 million in Q3 2025, representing Adjusted EBITDA Margin1 of 25.1%, a sequential increase of 20-basis points.
FY 2025
- Total net revenue was $500.6 million compared to $561.6 million in full year 2024 (“FY 2024”).
- Retail revenue was $339.6 million compared to $372.2 million in FY 2024.
- Wholesale revenue was $161.0 million compared to $189.4 million in FY 2024.
- · Net loss of $118.2 million compared to $85.0 million in FY 2024.
- Adjusted EBITDA1 was $116.9 million compared to $116.2 million in FY 2024, representing Adjusted EBITDA Margin1 of 23.4%.
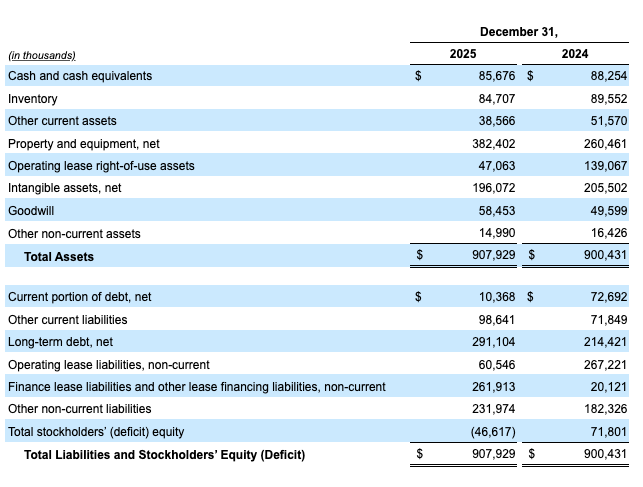
- Cash and cash equivalents of $85.7 million as of December 31, 2025.
Management Commentary
“2025 was a pivotal year for our business, marked by strong progress across our strategic pillars of densification, profitability, and sustainability,” said Sam Brill, Chief Executive Officer & Director of AWH. “Our retail footprint expanded with eight new locations, bringing the total to 48 to date and keeping us on track for our 60-store target by the end of 2026. Through disciplined execution, we exceeded our $30 million annualized cost savings target and strengthened our capital structure through a strategic refinancing that extends our debt obligations to 2029. Improvements in Adjusted EBITDA margin reflect our continued focus on optimizing product mix while maintaining prudent cost management. Enhancements to product quality have enabled us to compete effectively at compelling price points in a dynamic market, driving profitability across our finished goods portfolio. This momentum will fuel our 2026 priorities, focused on advancing retail densification, enhancing our retail model, and elevating our CPG platform to drive revenue per gram and high-margin sales through disciplined pricing, expanded distribution, and brand strength.”
“Our focus on CPG innovation drove meaningful portfolio expansion in 2025, including the launch of two new category-leading brands and a record number of SKUs,” said Frank Perullo, Founder, President & Director of AWH. “High Wired quickly emerged as a top performer in the infused flower category, ranking second in total sales and units in New Jersey, and third overall in sales and units across Illinois, Massachusetts, and New Jersey combined as of the end of Q4 2025. We optimized cultivation and manufacturing, invested in automation, and achieved record yields and potency levels to elevate quality and ensure the products reaching our customers are among the best we have ever produced. The implementation of our e-commerce platform and refreshed loyalty program has further enhanced customer engagement, accelerated product discovery, and improved retention. Together, these initiatives not only support competitive growth but establish a scalable platform to deliver high-quality products in markets where customers are ready to meet us.”
“In 2025, we strengthened our financial flexibility and expanded liquidity to support long-term growth,” said Roman Nemchenko, Chief Financial Officer of AWH. “By extending our debt profile and securing mortgage arrangements in Ohio, we established a stable capital foundation for disciplined expansion. With this platform in place, we are well positioned to continue improving our margin profile and driving profitability across the business. We entered 2026 with a robust balance sheet, a strong cash balance of $85.7 million, and a clear strategy to scale thoughtfully, pursue selective strategic M&A, and drive sustained value for our customers and shareholders.”
Q4 2025 Financial Overview
Net revenue totaled $120.5 million for Q4 2025, representing a 3.4% sequential decline.
Retail revenue was $85.0 million, an increase of 1.4% sequentially. The increase was driven by the ongoing ramp-up of new stores and increased in-house production of higher-margin finished goods, resulting in retail sales accounting for approximately 70.5% of total net revenue. This growth was constrained by continued pricing pressures and increased competition in various markets, as higher unit volumes were offset by lower average selling prices, affecting same-store sales in most markets.
Third-party wholesale revenue was $35.5 million, a 13.1% decrease from the prior quarter. The decline reflects the increased focus on routing biomass toward higher-margin finished goods for retail sales, alongside the ongoing impact of pricing pressures in Illinois and New Jersey.
Q4 2025 gross profit was $45.1 million, or 37.4% of revenue, as compared to $43.6 million, or 35.0% of revenue, in Q3 2025. Adjusted Gross Profit1 was $54.7 million, or 45.4% of revenue, for Q4 2025, as compared to $57.8 million, or 46.4% of revenue, for the prior quarter. The decline in Adjusted Gross Profit1 was primarily driven by overall lower sales and a 100-basis point sequential decrease in Adjusted Gross Margin1. Adjusted Gross Margin1 was impacted by market-wide seasonal discounting, which countered the improvements of increased verticality and improved third-party product margins.
Total general and administrative (“G&A”) expenses for Q4 2025 were $45.3 million, or 37.6% of revenue, compared to $44.9 million, or 36.0% of revenue, for the prior quarter, reflecting costs related to new store expansions as the Company advances its densification strategy, and partially mitigated by ongoing cost discipline.
Net loss for Q4 2025 was $48.7 million, compared to $25.8 million in Q3 2025. The change was primarily driven by higher G&A expenses, partially offset by ongoing cost-control and efficiency efforts, as well as margin profile expansion.
Adjusted EBITDA1 was $30.2 million in Q4 2025 compared to $31.1 million in Q3 2025, with an Adjusted EBITDA Margin1 of 25.1%, a 20-basis point increase from the prior quarter. The decrease reflects pricing pressures across several markets and a modest increase in G&A expenses, while the margin expansion demonstrates the benefits of the Company’s shift toward a more favorable product mix.
FY 2025 Financial Overview
Net revenue totaled $500.6 million for FY 2025, representing a 10.9% year-over-year decline.
Retail revenue was $339.6 million, an 8.8% decrease year-over-year, primarily due to ongoing pricing headwinds and reduced transaction volumes in several markets. The decrease was partially offset by the ongoing ramp-up of eight new stores opened during FY 2025.
Third-party wholesale revenue was $161.0 million, a 15.0% decrease from the prior year, primarily resulting from continued price compression across various markets and the aforementioned shift away from wholesale bulk sales in the second half of the year, partially mitigated by an increase in sales of larger format finished goods to close out the year.
FY 2025 gross profit was $169.7 million, or 33.9% of revenue, as compared to $184.2 million, or 32.8% of revenue, in FY 2024. Adjusted Gross Profit1 was $220.0 million, or 43.9% of revenue, as compared to $225.9 million, or 40.2% of revenue, in FY 2024. The decrease reflects market-driven price softness, partially offset by a higher vertical sales mix and improved margins on third-party products. Adjusted Gross Margin1 benefitted from reduced exposure to promotional cycles and disciplined pricing.
Total G&A expenses for FY 2025 were $169.7 million, or 33.9% of revenue, compared to $179.5 million, or 32.0% of revenue, for FY 2024. This reduction was driven by ongoing cost controls, partially offset by the continued execution of the Company’s retail expansion initiatives.
Net loss for FY 2025 was $118.2 million, compared to $85.0 million for FY 2024. The current year was impacted by higher interest expense but benefitted from margin profile improvements and continued cost-saving and operational efficiency initiatives.
Adjusted EBITDA1 was $116.9 million in FY 2025, compared to $116.2 million in FY 2024, with an Adjusted EBITDA Margin1 of 23.4%. The improvement was largely attributed to a reduction in G&A expenses and a shift toward a higher-margin finished goods product mix, partially impacted by ongoing price compression.
Balance Sheet
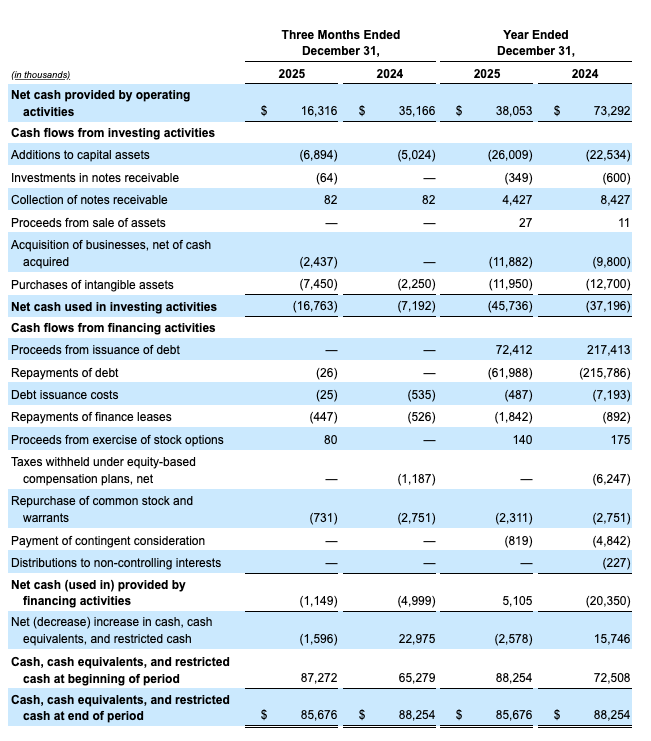
Cash and cash equivalents as of December 31, 2025, were $85.7 million and Net Debt6 was $215.8 million. Net cash flows from operating activities were $16.3 million during Q4 2025.
The Company invested a total of $26.0 million in capital expenditures during FY 2025, allocated to retail network expansion, facility upgrades and improvements, and automation projects across its footprint.
As of Q4 2025, the Company reserved $17.0 million related to the settlement of an arbitration matter. Additional information regarding the matter is available in the Company’s Form 8-K filed on February 13, 2026. The matter has been fully resolved in Q1 2026.
Outlook
Looking ahead to Q1 2026, the Company expects a low to mid-single digit decline in topline revenue, reflecting post-holiday consumer softness, ongoing pricing headwinds, and weather-related closures across several markets during the early part of the quarter. Despite these pressures, Adjusted EBITDA Margin1 is expected to remain in the low-20% range. The Company is cautiously optimistic that the impact of continued price compression is anticipated to be partially offset by the commercialization of higher-margin SKUs, new store openings, and continued increases in direct-to-consumer vertical sales.
- Measure is a non-GAAP financial measure. Please see “Non-GAAP Financial Information and Definitions” below and “Reconciliations of Non-GAAP Financial Measures (Unaudited)” at the end of this press release.
- Includes both Company-owned and retail partner locations.
- Source: BDSA
- The Notes form part of the same series of the $250 million aggregate principal amount of the Company’s 12.75% senior secured notes due 2029, of which $235 million aggregate principal amount was issued on July 16, 2024 and $15 million aggregate principal amount was issued on January 13, 2025. The Notes were issued at a price of 97.5% of face value pursuant to and governed by a trust indenture entered into as of July 16, 2024, as amended and supplemented by a first supplemental indenture dated as of January 13, 2025.
- Under the Buyback Program, the Company was eligible to repurchase up to the lesser of: (i) 10,215,690 shares of the Company’s Class A common stock (“Common Shares”); and (ii) $2.25 million worth of Common Shares, in the open market. Total shares repurchased includes 11 million shares repurchased in a private transaction in Q4 2024.
- Net Debt is a non-GAAP financial measure defined as total debt, net of unamortized deferred financing costs of ~$301.5 million, less cash and cash equivalents of $85.7 million as of December 31, 2025. Please see “Non-GAAP Financial Information” below.
Earnings Conference Call
The Company will hold a conference call today, Thursday, March 12, 2026, at 5:00 PM ET, to discuss its fourth quarter and full year 2025 results. The call can be accessed by dialing 1-888-699-1199, and a live audio webcast will be available at this link. The webcast will also be archived for replay via the Investor Relations section of the AWH website at https://awholdings.com/investors. A telephone replay will be available by calling 1-888-660-6345 with replay code 66620# until midnight ET on Thursday, March 19, 2026.About Ascend Wellness Holdings, Inc.
AWH is a vertically integrated cannabis operator with assets in Illinois, Maryland, Massachusetts, Michigan, New Jersey, Ohio, and Pennsylvania. AWH owns and operates state-of-the-art cultivation facilities, growing award-winning strains and producing a curated selection of products for retail and wholesale customers. AWH produces and distributes its in-house Ozone, Simply Herb, High Wired, Honor Roll, Royale, and Effin’ branded products. For more information about AWH, visit www.awholdings.com.Non-GAAP Financial Information and Definitions
This press release includes certain non-GAAP financial measures as defined by the U.S. Securities and Exchange Commission (“SEC”). Reconciliations of these non-GAAP financial measures to the most directly comparable financial measure calculated and presented in accordance with GAAP are included in the financial schedules attached to this press release or in other information contained herein. This information should be considered as supplemental in nature and not as a substitute for, or superior to, any measure of performance prepared in accordance with GAAP. Adjusted EBITDA/Margin and Adjusted Gross Profit/Margin are non-GAAP financial measures. Please see “Reconciliations of Non-GAAP Financial Measures (Unaudited)” at the end of this release. We define Net Debt as total debt, net of unamortized deferred financing costs, less cash and cash equivalents, which components are disclosed in the Company’s Selected Condensed Consolidated Balance Sheet Information (Unaudited) included in the financial schedules attached to this press release under the captions “Current portion of debt, net,” “Long-term debt, net,”, and “Cash and cash equivalents.” We believe this measure is an important indicator of the Company’s ability to service its long-term debt obligations. This non-GAAP financial measure should not be considered in isolation of, or as a substitute for, the most directly comparable GAAP financial measures as an indicator of operating performance or liquidity and may not be comparable to similarly titled measures provided by other companies.Cautionary Note Regarding Forward-Looking Information
This news release contains forward-looking information and forward-looking statements (collectively, “forward-looking statements”) within the meaning of applicable U.S. and Canadian securities laws, which may include, but are not limited to, the plans, intentions, expectations, estimates, and beliefs of the Company. Words such as “expects”, “continue(s)”, “may”, “will”, “anticipates”, and “intends” or similar expressions are intended to identify forward-looking statements. Without limiting the generality of the preceding statement, all statements in this press release relating to estimated and projected revenue, expectations regarding production capacity, anticipated capital expenditures, expansion, profit, product demand, margins, costs, cash flows, sources of capital, growth rates, potential acquisitions, closing dates for transactions, regulatory approvals, future facility openings, and future financial and operating results are forward-looking statements. We caution investors that any such forward-looking statements are based on the Company’s current projections and expectations about future events and financial trends, the receipt of all required regulatory approvals, and on certain assumptions, estimates and analysis made by the Company in light of the experience of the Company and its perception of historical trends, current conditions, and expected future developments and other factors that management believes are appropriate. Forward-looking statements involve and are subject to assumptions and known and unknown risks, uncertainties, and other factors which may cause actual events, results, performance, or achievements of the Company to be materially different from future events, results, performance, and achievements expressed or implied by forward-looking statements herein. Such factors include, without limitation, the risks and uncertainties identified in the Company’s most recently filed Annual Report on Form 10-K, as updated in subsequently filed Quarterly Reports on Form 10-Q, as applicable, and in the Company’s other reports and filings with the applicable Canadian securities administrators on its profile on SEDAR+ at www.sedarplus.ca and the SEC on its profile on EDGAR at www.sec.gov. Readers are cautioned that the foregoing list of factors is not exhaustive. Although the Company believes that any forward-looking statements herein are reasonable, in light of the use of assumptions and the significant risks and uncertainties inherent in such statements, there can be no assurance that any such forward-looking statements will prove to be accurate, and accordingly readers are advised to rely on their own evaluation of such risks and uncertainties and should not place undue reliance upon such forward-looking statements. Any forward-looking statements herein are made as of the date hereof, and except as required by applicable laws, the Company assumes no obligation and disclaims any intention to update or revise any forward-looking statements herein or to update the reasons that actual events or results could or do differ from those projected in any forward-looking statements herein, whether as a result of new information, future events or results, or otherwise, except as required by applicable laws. No securities regulator nor the Canadian Securities Exchange has reviewed, approved, or disapproved the content of this press release.Preliminary Financial Metrics
This press release contains certain preliminary financial metrics for the fourth quarter and full year 2025. Financial metrics contained in this press release are preliminary and represent the most current information available to the Company’s management, as financial closing procedures for the three months and year ended December 31, 2025 are not yet complete. The Company’s actual consolidated audited financial statements for such period will be filed with the SEC on its profile on EDGAR at www.sec.gov and with the applicable Canadian securities administrators on its profile on SEDAR at https://www.sedarplus.ca/. The final results for such periods may differ materially from the financial metrics summarized in this press release as a result of the completion of normal quarter-end and year-end accounting procedures, audit adjustments, and other developments that may arise prior to the filing of the Company’s consolidated financial statements. Although the Company believes the expectations reflected in this press release are based upon reasonable assumptions, the Company can give no assurance that actual results will not differ materially from these expectations. Company: Frank Perullo Founder, President & Director IR@awholdings.com Investor Relations & Media Inquiries: MATTIO Communications AWH@mattio.com IR@awholdings.com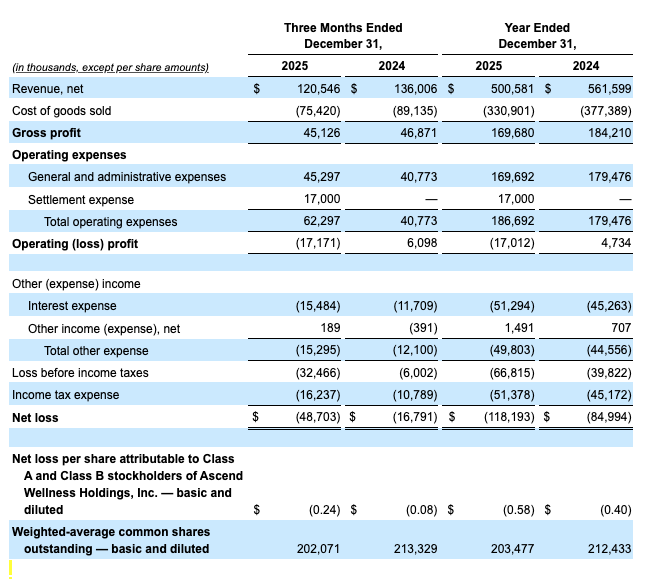
We define “Adjusted Gross Profit” as gross profit excluding non-cash inventory costs, which include depreciation and amortization included in cost of goods sold, equity-based compensation included in cost of goods sold, and other non-cash inventory adjustments. We define “Adjusted Gross Margin” as Adjusted Gross Profit as a percentage of net revenue. Our “Adjusted EBITDA” is a non-GAAP measure used by management that is not defined by GAAP and may not be comparable to similar measures presented by other companies. We define “Adjusted EBITDA Margin” as Adjusted EBITDA as a percentage of net revenue. Management calculates Adjusted EBITDA as the reported net loss, adjusted to exclude: income tax expense, other (income) expense, interest expense, depreciation and amortization, depreciation and amortization included in cost of goods sold, non-cash inventory adjustments, equity-based compensation, equity-based compensation included in cost of goods sold, start-up costs, start-up costs included in cost of goods sold, transaction-related and other non-recurring expenses, gain or loss on sale of assets, and litigation settlement. Accordingly, management believes that Adjusted EBITDA provides meaningful and useful financial information, as this measure demonstrates the operating performance of the business. The tables below provide reconciliations of these non-GAAP measures to the most comparable GAAP financial measure. Non-GAAP financial measures may be considered in addition to the results prepared in accordance with GAAP, but they should not be considered a substitute for, or superior to, GAAP results. The Company’s presentation of these financial measures may not be comparable to similar non-GAAP measures used by other companies. These financial measures are intended to provide additional information to investors regarding the Company’s performance.
The following table presents Adjusted Gross Profit for the quarter and year ended December 31, 2025 and 2024:
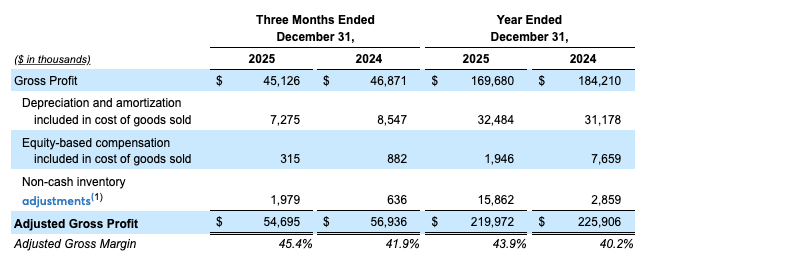
(1) Consists of write-offs of expired products, obsolete packaging, and net realizable value adjustments related to certain inventory items.
(2) One-time costs associated with acquiring real estate, obtaining licenses and permits, and other costs incurred before commencement of operations at certain locations, as well as incremental expenses associated with the expansion of activities at our cultivation facilities that are not yet operating at scale, other expenses resulting from delays in regulatory approvals, and other related one-time or non-recurring expenses, as applicable. The three months and year ended December 31, 2025 include $3,162 and $9,855, respectively, of unallocated overhead expenses at certain cultivation facilities resulting from rebalancing of overhead expenses from cost of goods sold to general and administrative expenses based on overhead allocations relative to production output at those locations.
(3) Other non-recurring expenses including legal and professional fees associated with litigation matters, potential acquisitions, other regulatory matters, and other reserves or one-time expenses, including certain non-recurring professional fees and severance expenses associated with certain strategic initiatives. The three months and year ended December 31, 2025 each include a benefit of $1,250 related to a consideration adjustment for a prior acquisition and a net benefit of $927 and $647, respectively, related to fair value adjustments associated with acquisition earn-outs. The year ended December 31, 2025 includes approximately $1,100 of expenses associated with term loans that were issued during the year. The year ended December 31, 2024 includes a reserve of $5,447 related to certain amounts associated with a previous transaction, a reserve of $2,083 and a $984 discount that are associated with a long-term receivable, approximately $3,600 of expenses associated with our 2024 debt refinancing, and $630 related to an acquisition earn-out.